This article shows how to add a chart to a Google Sheet from PHP, and how to put a second series on its own axis when the two do not share a scale. It also covers the difference between one floating over the grid and one that gets a tab to itself.
This is the Google Sheets counterpart to creating an Excel chart with PhpSpreadsheet, and the two take very different shapes. PhpSpreadsheet assembles objects — DataSeries, PlotArea, Legend — and writes them into the file. Here, by contrast, one request holds one nested array, and Google draws it.
The addChart request takes a spec, which says what to plot, and a position, which says where to put it. Almost everything interesting lives in how you address the data sources.
Requirements to add a chart:
- Authenticate With A Service Account
- Create A Google Cloud Project
- Enable Google Sheets API Library
- Install The Google Client Library Specifying Google Sheets
- Composer
- PHP 8.1 or newer
Step 1.
First, set up the dependencies. This is the Sheets-only install used across this series. Tested with google/apiclient 2.19 on PHP 8.5.
{
    "require": {
        "google/apiclient": "^2.12.1"
    },
    "scripts": {
        "pre-autoload-dump": "Google\\Task\\Composer::cleanup"
    },
    "extra": {
        "google/apiclient-services": [
            "Sheets"
        ]
    }
}
Step 2.
Next, install the Google Client Library.
$ composer install
Step 3.
Then build the client and write six months of figures on a fresh tab. Revenue runs to five digits and refunds to three, which is deliberate — it is what makes the second axis in Step 6 worth having.
<?php

require 'vendor/autoload.php';

use Google\Client;
use Google\Service\Sheets;
use Google\Service\Sheets\BatchUpdateSpreadsheetRequest;
use Google\Service\Sheets\Request;
use Google\Service\Sheets\ValueRange;

$spreadsheetId = 'YOUR_SPREADSHEET_ID';
$keyFile = 'service-account.json';
$tabName = 'Revenue';

$client = new Client();
$client->setApplicationName('Chart Demo');
$client->setAuthConfig($keyFile);
$client->addScope(Sheets::SPREADSHEETS);

$service = new Sheets($client);

$sheetId = freshSheetId($service, $spreadsheetId, $tabName);

$service->spreadsheets_values->update(
    $spreadsheetId,
    $tabName . '!A1',
    new ValueRange(['values' => [
        ['Month', 'Revenue', 'Refunds'],
        ['Jan', 12400, 320],
        ['Feb', 15100, 410],
        ['Mar', 13800, 260],
        ['Apr', 17250, 540],
        ['May', 16900, 375],
        ['Jun', 19400, 610],
    ]]),
    ['valueInputOption' => 'USER_ENTERED']
);
Step 4.
A chart does not take A1 notation. Every axis and every series is a GridRange — sheet id plus zero-based, half-open row and column bounds — wrapped in a sourceRange that can hold several of them.
That nesting is four levels deep and it repeats for every column you plot, so it is worth a helper.
function column(int $sheetId, int $columnIndex, int $rows): array
{
    return ['sourceRange' => ['sources' => [[
        'sheetId'          => $sheetId,
        'startRowIndex'    => 0,
        'endRowIndex'      => $rows,
        'startColumnIndex' => $columnIndex,
        'endColumnIndex'   => $columnIndex + 1,
    ]]]];
}
Note it starts at row 0, taking in the heading. That is on purpose — the heading is what names the series in the legend, once Step 5 tells the chart it is there.
Step 5.
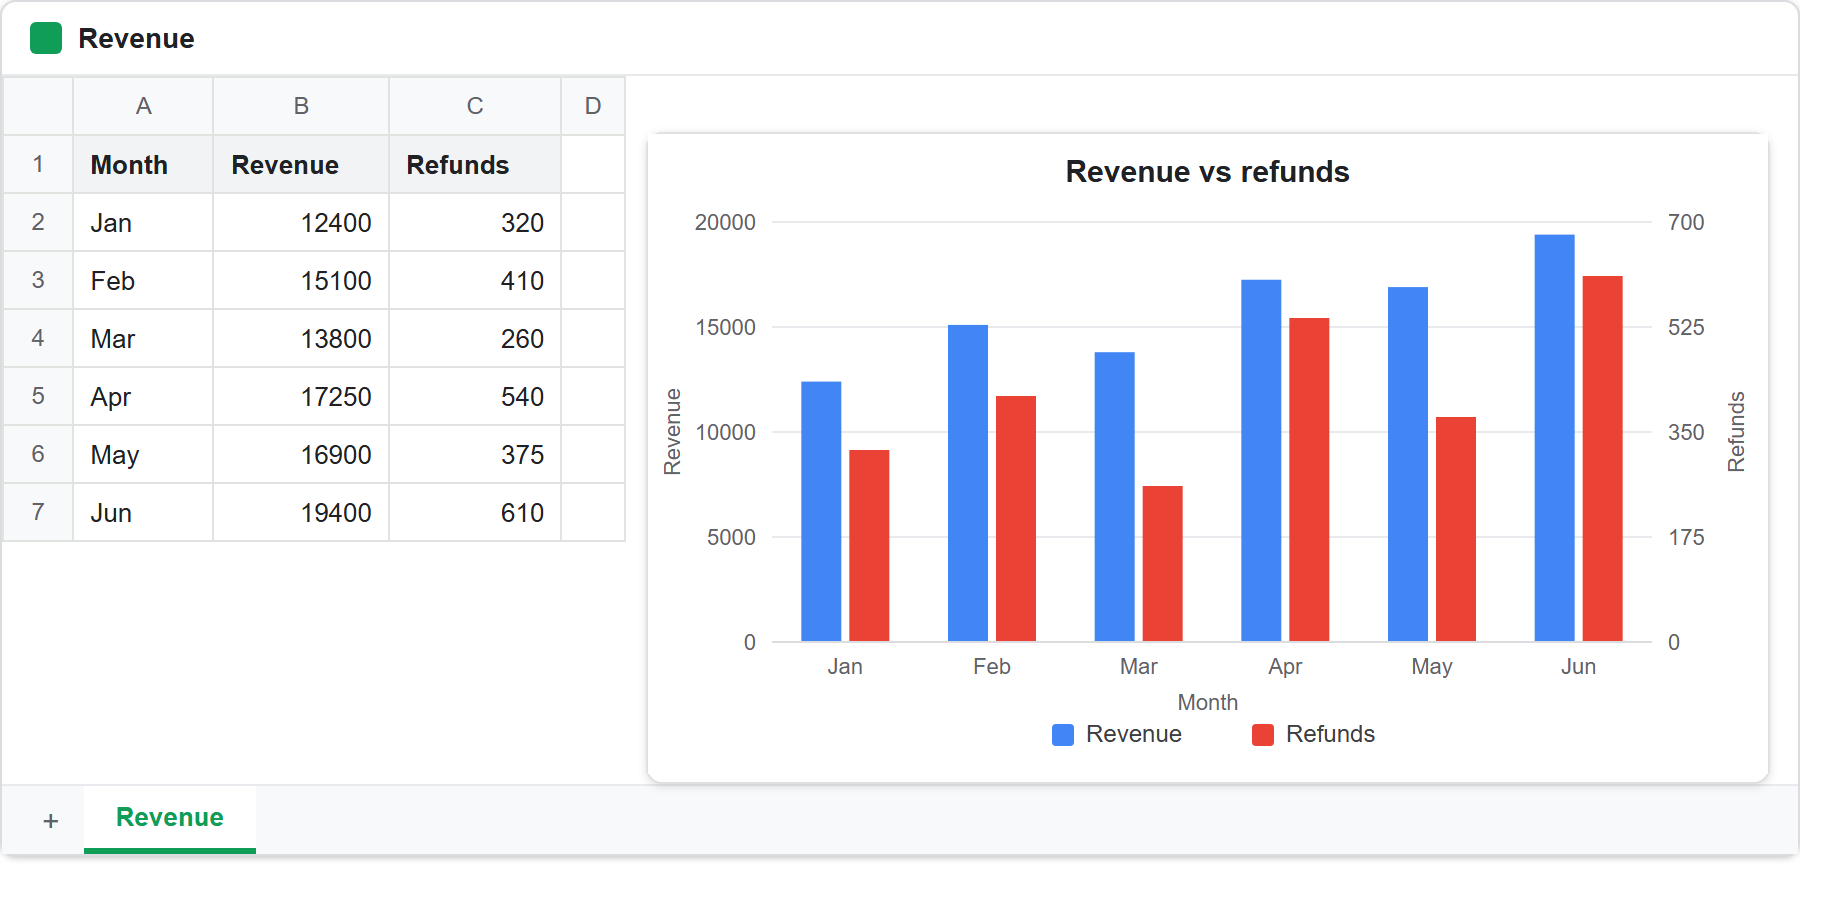
Now the chart. The domain is the category axis, Month. Each entry in series is one plotted column.
headerCount => 1 is what makes the first row a label rather than a data point. Leave it out and the chart plots the word Revenue as a value it cannot parse, and calls the series “Series 1”.
$embedded = chartRequest($service, $spreadsheetId, [
    'spec' => [
        'title'      => 'Revenue vs refunds',
        'basicChart' => [
            'chartType'      => 'COLUMN',
            'headerCount'    => 1,
            'legendPosition' => 'BOTTOM_LEGEND',
            'axis'           => [
                ['position' => 'BOTTOM_AXIS', 'title' => 'Month'],
                ['position' => 'LEFT_AXIS', 'title' => 'Revenue'],
                ['position' => 'RIGHT_AXIS', 'title' => 'Refunds'],
            ],
            'domains'        => [
                ['domain' => column($sheetId, 0, $rows)],
            ],
            'series'         => [
                ['series' => column($sheetId, 1, $rows), 'targetAxis' => 'LEFT_AXIS'],
                ['series' => column($sheetId, 2, $rows), 'targetAxis' => 'RIGHT_AXIS'],
            ],
        ],
    ],
    'position' => ['overlayPosition' => [
        'anchorCell'    => ['sheetId' => $sheetId, 'rowIndex' => 1, 'columnIndex' => 4],
        'offsetXPixels' => 10,
        'offsetYPixels' => 10,
        'widthPixels'   => 560,
        'heightPixels'  => 320,
    ]],
]);
Step 6.
The two targetAxis values are the point of that spec. Revenue is in the tens of thousands and refunds in the hundreds; put both on one axis and the refunds series is a flat line along the bottom, technically present and completely unreadable.
RIGHT_AXIS gives the second series its own scale, so both are legible in one picture. Declare the axis in axis to give it a title, and point the series at it:
['position' => 'RIGHT_AXIS', 'title' => 'Refunds'],
...
['series' => column($sheetId, 2, $rows), 'targetAxis' => 'RIGHT_AXIS'],
Step 7.
Now the other kind of position. newSheet => true asks for a tab of its own instead of a box floating over the data. That is the right choice for a chart people come to look at, rather than one annotating a table.
$own = chartRequest($service, $spreadsheetId, [
    'spec' => [
        'title'      => 'Revenue only',
        'basicChart' => [
            'chartType'   => 'LINE',
            'headerCount' => 1,
            'domains'     => [
                ['domain' => column($sheetId, 0, $rows)],
            ],
            'series'      => [
                ['series' => column($sheetId, 1, $rows)],
            ],
        ],
    ],
    'position' => ['newSheet' => true],
]);

printf("  newSheet     : %s\n", var_export($own->getPosition()->getNewSheet(), true));
printf("  sheetId      : %s\n", var_export($own->getPosition()->getSheetId(), true));
Step 8.
Finally, remove one. The API treats these as embedded objects rather than as a type of their own, so the id you pass is the chartId.
$service->spreadsheets->batchUpdate($spreadsheetId, new BatchUpdateSpreadsheetRequest([
    'requests' => [
        new Request(['deleteEmbeddedObject' => ['objectId' => $own->getChartId()]]),
    ],
]));
Complete code to add a chart.
<?php

require 'vendor/autoload.php';

use Google\Client;
use Google\Service\Sheets;
use Google\Service\Sheets\BatchUpdateSpreadsheetRequest;
use Google\Service\Sheets\Request;
use Google\Service\Sheets\ValueRange;

$spreadsheetId = 'YOUR_SPREADSHEET_ID';
$keyFile = 'service-account.json';
$tabName = 'Revenue';

$client = new Client();
$client->setApplicationName('Chart Demo');
$client->setAuthConfig($keyFile);
$client->addScope(Sheets::SPREADSHEETS);

$service = new Sheets($client);

/**
 * Return a brand-new tab with this name, deleting any previous one.
 */
function freshSheetId(Sheets $service, string $spreadsheetId, string $title): int
{
    $requests = [];

    foreach ($service->spreadsheets->get($spreadsheetId)->getSheets() as $sheet) {
        if ($sheet->getProperties()->getTitle() === $title) {
            $requests[] = new Request([
                'deleteSheet' => ['sheetId' => $sheet->getProperties()->getSheetId()],
            ]);
        }
    }

    $requests[] = new Request(['addSheet' => ['properties' => ['title' => $title]]]);

    $response = $service->spreadsheets->batchUpdate($spreadsheetId, new BatchUpdateSpreadsheetRequest([
        'requests' => $requests,
    ]));

    $replies = $response->getReplies();

    return end($replies)->getAddSheet()->getProperties()->getSheetId();
}

/**
 * One column of the fixture, as a chart data source.
 *
 * Every domain and every series is a GridRange, so this is the piece that
 * repeats most: a whole column including its heading.
 */
function column(int $sheetId, int $columnIndex, int $rows): array
{
    return ['sourceRange' => ['sources' => [[
        'sheetId'          => $sheetId,
        'startRowIndex'    => 0,
        'endRowIndex'      => $rows,
        'startColumnIndex' => $columnIndex,
        'endColumnIndex'   => $columnIndex + 1,
    ]]]];
}

/** Send one chart request and return the reply object. */
function chartRequest(Sheets $service, string $spreadsheetId, array $chart)
{
    $response = $service->spreadsheets->batchUpdate($spreadsheetId, new BatchUpdateSpreadsheetRequest([
        'requests' => [
            new Request(['addChart' => ['chart' => $chart]]),
        ],
    ]));

    return $response->getReplies()[0]->getAddChart()->getChart();
}

$sheetId = freshSheetId($service, $spreadsheetId, $tabName);

$service->spreadsheets_values->update(
    $spreadsheetId,
    $tabName . '!A1',
    new ValueRange(['values' => [
        ['Month', 'Revenue', 'Refunds'],
        ['Jan', 12400, 320],
        ['Feb', 15100, 410],
        ['Mar', 13800, 260],
        ['Apr', 17250, 540],
        ['May', 16900, 375],
        ['Jun', 19400, 610],
    ]]),
    ['valueInputOption' => 'USER_ENTERED']
);

$rows = 7;

// ------------------------------------------------ a column chart on the sheet
$embedded = chartRequest($service, $spreadsheetId, [
    'spec' => [
        'title'      => 'Revenue vs refunds',
        'basicChart' => [
            'chartType'      => 'COLUMN',
            'headerCount'    => 1,
            'legendPosition' => 'BOTTOM_LEGEND',
            'axis'           => [
                ['position' => 'BOTTOM_AXIS', 'title' => 'Month'],
                ['position' => 'LEFT_AXIS', 'title' => 'Revenue'],
                ['position' => 'RIGHT_AXIS', 'title' => 'Refunds'],
            ],
            'domains'        => [
                ['domain' => column($sheetId, 0, $rows)],
            ],
            'series'         => [
                ['series' => column($sheetId, 1, $rows), 'targetAxis' => 'LEFT_AXIS'],
                ['series' => column($sheetId, 2, $rows), 'targetAxis' => 'RIGHT_AXIS'],
            ],
        ],
    ],
    'position' => ['overlayPosition' => [
        'anchorCell'    => ['sheetId' => $sheetId, 'rowIndex' => 1, 'columnIndex' => 4],
        'offsetXPixels' => 10,
        'offsetYPixels' => 10,
        'widthPixels'   => 560,
        'heightPixels'  => 320,
    ]],
]);

printf("Embedded chart added.\n");
printf("  chartId      : %d\n", $embedded->getChartId());
printf("  anchored at  : row %d, column %d of sheet %d\n",
    $embedded->getPosition()->getOverlayPosition()->getAnchorCell()->getRowIndex(),
    $embedded->getPosition()->getOverlayPosition()->getAnchorCell()->getColumnIndex(),
    $embedded->getPosition()->getOverlayPosition()->getAnchorCell()->getSheetId()
);

// ------------------------------------------------- a line chart on its own tab
$own = chartRequest($service, $spreadsheetId, [
    'spec' => [
        'title'      => 'Revenue only',
        'basicChart' => [
            'chartType'   => 'LINE',
            'headerCount' => 1,
            'domains'     => [
                ['domain' => column($sheetId, 0, $rows)],
            ],
            'series'      => [
                ['series' => column($sheetId, 1, $rows)],
            ],
        ],
    ],
    'position' => ['newSheet' => true],
]);

printf("\nChart on its own sheet added.\n");
printf("  chartId      : %d\n", $own->getChartId());
printf("  newSheet     : %s\n", var_export($own->getPosition()->getNewSheet(), true));
printf("  sheetId      : %s\n", var_export($own->getPosition()->getSheetId(), true));

// ------------------------------------------------------------- what is where
$meta = $service->spreadsheets->get($spreadsheetId, [
    'fields' => 'sheets(properties(sheetId,title,sheetType),charts(chartId,spec(title)))',
]);

echo "\nCharts in this spreadsheet:\n";

foreach ($meta->getSheets() as $sheet) {
    foreach ($sheet->getCharts() ?? [] as $chart) {
        printf("  %-12d %-20s on '%s' (%s)\n",
            $chart->getChartId(),
            $chart->getSpec()->getTitle(),
            $sheet->getProperties()->getTitle(),
            $sheet->getProperties()->getSheetType()
        );
    }
}

// ------------------------------------------------------------- and remove one
$service->spreadsheets->batchUpdate($spreadsheetId, new BatchUpdateSpreadsheetRequest([
    'requests' => [
        new Request(['deleteEmbeddedObject' => ['objectId' => $own->getChartId()]]),
    ],
]));

printf("\nDeleted chart %d with deleteEmbeddedObject.\n", $own->getChartId());

$meta = $service->spreadsheets->get($spreadsheetId, [
    'fields' => 'sheets(properties(sheetId,title,sheetType),charts(chartId))',
]);

echo "What is left:\n";
foreach ($meta->getSheets() as $sheet) {
    if ($sheet->getProperties()->getSheetType() !== 'OBJECT'
        && $sheet->getProperties()->getSheetId() !== $sheetId) {
        continue;
    }

    printf("  %-10s %-7s charts=%d\n",
        $sheet->getProperties()->getTitle(),
        $sheet->getProperties()->getSheetType(),
        count($sheet->getCharts() ?? [])
    );
}
Test how to add a chart.
$ php chart.php
Result of the code to add a chart.
Embedded chart added.
  chartId      : 599556021
  anchored at  : row 1, column 4 of sheet 2080850316

Chart on its own sheet added.
  chartId      : 1539661137
  newSheet     : NULL
  sheetId      : 1832334216

Charts in this spreadsheet:
  599556021    Revenue vs refunds   on 'Revenue' (GRID)
  1539661137   Revenue only         on 'Chart8' (OBJECT)

Deleted chart 1539661137 with deleteEmbeddedObject.
What is left:
  Revenue    GRID    charts=1
  Chart8     OBJECT  charts=0
Add a chart with newSheet, and get a sheetId back.
The second reply is the one to read carefully. The request said 'newSheet' => true. The reply says:
newSheet     : NULL
sheetId      : 1832334216
newSheet is not a property of the object at all. It is an instruction, meaning “make somewhere to put this”, and once the API has done that there is nothing left to report — the drawing sits on a specific sheet, and that sheet now has an id.
So the position object you send and the position object you get back are not the same shape. As a result, feeding a reply straight back into a later request will not reproduce the chart. Keep the sheetId if you plan to rename that tab, link to it, or delete it — it is the only handle the API hands you.
The tab it created is called Chart8 here only because this spreadsheet has held charts before; the counter runs per spreadsheet, so a fresh file gives you Chart1. Its sheetType is OBJECT rather than GRID, which is the reliable way to tell chart sheets from data sheets when you walk a spreadsheet. The name, after all, is just a default anyone can change.
Delete the chart and its sheet stays behind.
The last two lines are worth knowing before you write a cleanup job:
Revenue    GRID    charts=1
Chart8     OBJECT  charts=0
deleteEmbeddedObject did its job — Chart8 holds none. But Chart8 itself is still there, an empty tab with nothing on it.
That is consistent, if not what you would guess. Positioning it created the sheet as a side effect, and it never owned that sheet afterwards. So a job that regenerates its figures nightly and deletes the old ones first will accumulate one dead tab per run. Delete the sheet as well, with deleteSheet on the sheetId from the reply, and everything on it goes too.
Add a chart legend on basicChart, not on the spec.
One error worth recognising, because the message does not point at the fix:
Invalid JSON payload received. Unknown name "legendPosition"
at 'requests[0].add_chart.chart.spec': Cannot find field.
legendPosition sits on basicChart, one level deeper than title, which sits on spec. Both read like properties of the same object, and the split is real: spec holds what is true of every kind, while basicChart holds what is true of the bar-line-column family. A pie has a legend too, for example, and you configure that one on pieChart.
The general lesson is that the API rejects unknown fields rather than ignoring them, which is a kindness. So a typo or a misplaced key fails loudly at the first request, instead of producing a chart that quietly lacks the thing you asked for.