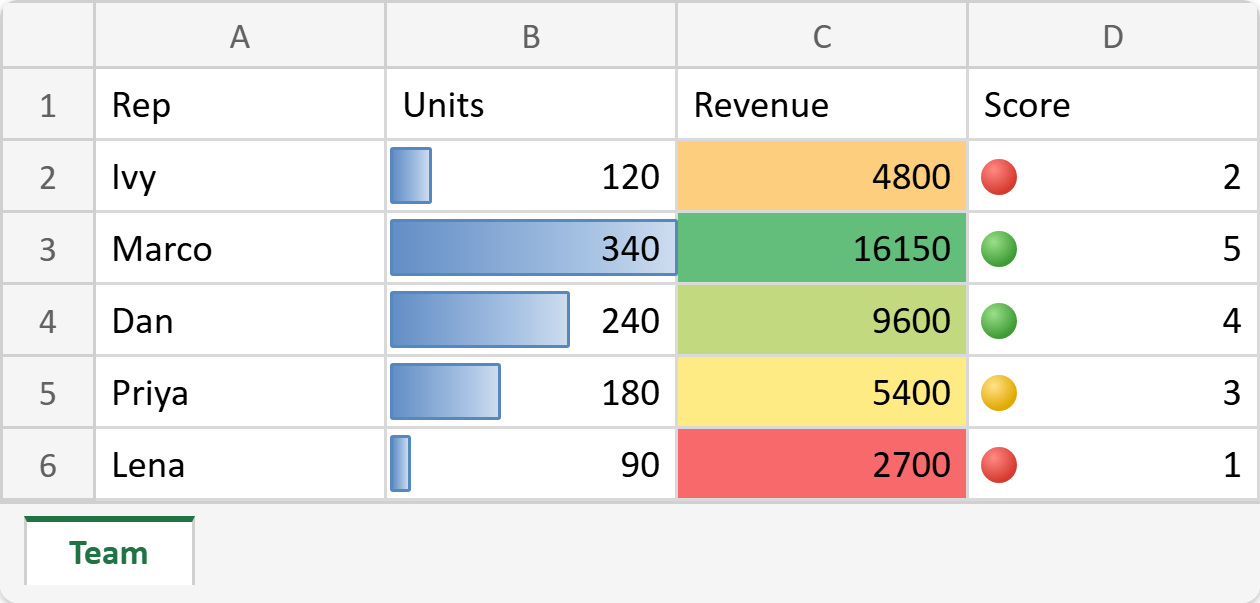
This article shows how to add data bars in PHP with the latest version of PhpSpreadsheet. It also covers the other two graphical conditional formats: color scales and icon sets. These are the ones people actually picture when they think of conditional formatting. For example, a blue bar filling each cell, a red-to-green heat map, or a row of traffic lights. However, they are a different API from the rule-based kind, so the existing conditional formatting post does not reach them.
The difference is worth stating up front. A rule-based format is a condition: if the value is over 200, paint the cell. It has one style and the cell either gets it or does not. A graphical format, by contrast, has no condition at all. Excel formats every cell in the range, and only the amount varies. In fact it scales between a minimum and a maximum you define. Consequently you never set a Style on these rules. Instead you attach a ConditionalDataBar, a ConditionalColorScale or a ConditionalIconSet object. So one object, not a style, is all it takes to add data bars in PHP.
Below we build a small sales sheet and give three of its columns one treatment each. Then comes the checking. Bars and icons only appear once you open the file in Excel. So we finish by asking PhpSpreadsheet, on the PHP side, what color the scale assigns to each value. Finally we read all three rules back out of the saved file, which proves they survived the round trip.
Requirements to add data bars in PHP:
- Composer
- PHP 8.2 or newer
Step 1.
First, set up the dependencies. Here we pin the latest major release of PhpSpreadsheet (the 5.x line, tested with 5.9).
{
    "require": {
        "phpoffice/phpspreadsheet": "^5.0"
    }
}
Step 2.
Next, install phpspreadsheet.
$ composer install
Step 3.
Then create a new PHP file. The import list is longer than usual here. Each of the three formats has its own class. Moreover the values that mark the ends of a scale have one too.
<?php

require 'vendor/autoload.php';

use PhpOffice\PhpSpreadsheet\IOFactory;
use PhpOffice\PhpSpreadsheet\Spreadsheet;
use PhpOffice\PhpSpreadsheet\Style\Color;
use PhpOffice\PhpSpreadsheet\Style\Conditional;
use PhpOffice\PhpSpreadsheet\Style\ConditionalFormatting\ConditionalColorScale;
use PhpOffice\PhpSpreadsheet\Style\ConditionalFormatting\ConditionalDataBar;
use PhpOffice\PhpSpreadsheet\Style\ConditionalFormatting\ConditionalFormatValueObject;
use PhpOffice\PhpSpreadsheet\Style\ConditionalFormatting\ConditionalIconSet;
use PhpOffice\PhpSpreadsheet\Style\ConditionalFormatting\IconSetValues;
use PhpOffice\PhpSpreadsheet\Writer\Xlsx;
Step 4.
Next, lay down the data. Each of the three numeric columns gets a different treatment later. So we deliberately spread the values out, because a bar chart of identical numbers proves nothing.
$spreadsheet = new Spreadsheet();
$worksheet = $spreadsheet->getActiveSheet();
$worksheet->setTitle('Team');
$worksheet->fromArray([
    ['Rep', 'Units', 'Revenue', 'Score'],
    ['Ivy', 120, 4800, 2],
    ['Marco', 340, 16150, 5],
    ['Dan', 240, 9600, 4],
    ['Priya', 180, 5400, 3],
    ['Lena', 90, 2700, 1],
], null, 'A1');
Step 5.
Then add the data bar. The two ConditionalFormatValueObjects say where the bar is empty and where it is full. Here 'min' and 'max' mean “the smallest and largest values in the range”. As a result, the bars rescale themselves if the data changes. Also note the color is ARGB, not RGB. The leading FF is the alpha channel, and leaving it off is the most common mistake here.
// 1. Data bar: a bar drawn inside each cell of B2:B6.
$dataBar = new ConditionalDataBar();
$dataBar->setColor('FF638EC6');
$dataBar->setMinimumConditionalFormatValueObject(new ConditionalFormatValueObject('min'));
$dataBar->setMaximumConditionalFormatValueObject(new ConditionalFormatValueObject('max'));

$bar = new Conditional();
$bar->setConditionType(Conditional::CONDITION_DATABAR);
$bar->setDataBar($dataBar);
$worksheet->getStyle('B2:B6')->setConditionalStyles([$bar]);
Step 6.
Next, the color scale. This one takes three points rather than two. So the fill blends from red at the bottom, through yellow in the middle, to green at the top. Here the midpoint is the 'percentile' 50 rather than the arithmetic mean, which is what Excel itself defaults to. Therefore a single huge outlier will not drag the whole middle of your heat map toward red.
// 2. Colour scale: red -> yellow -> green across C2:C6.
$colorScale = new ConditionalColorScale();
$colorScale->setMinimumConditionalFormatValueObject(new ConditionalFormatValueObject('min'));
$colorScale->setMidpointConditionalFormatValueObject(new ConditionalFormatValueObject('percentile', 50));
$colorScale->setMaximumConditionalFormatValueObject(new ConditionalFormatValueObject('max'));
$colorScale->setMinimumColor(new Color('FFF8696B'));
$colorScale->setMidpointColor(new Color('FFFFEB84'));
$colorScale->setMaximumColor(new Color('FF63BE7B'));

$scale = new Conditional();
$scale->setConditionType(Conditional::CONDITION_COLORSCALE);
$scale->setColorScale($colorScale);
$worksheet->getStyle('C2:C6')->setConditionalStyles([$scale]);
Step 7.
Then the icon set. IconSetValues is an enum. So your editor lists the seventeen built-in sets rather than leaving you to guess a string. The three cfvos are the thresholds between icons, given here as percentages. For example, below 33 is a red light, 33 to 67 amber, above 67 green. Finally, setShowValue(true) keeps the number visible next to the icon; pass false and the cell shows the icon alone.
// 3. Icon set: three traffic lights over D2:D6.
$iconSet = new ConditionalIconSet();
$iconSet->setIconSetType(IconSetValues::ThreeTrafficLights1);
$iconSet->setShowValue(true);
$iconSet->setCfvos([
    new ConditionalFormatValueObject('percent', 0),
    new ConditionalFormatValueObject('percent', 33),
    new ConditionalFormatValueObject('percent', 67),
]);

$icons = new Conditional();
$icons->setConditionType(Conditional::CONDITION_ICONSET);
$icons->setIconSet($iconSet);
$worksheet->getStyle('D2:D6')->setConditionalStyles([$icons]);

(new Xlsx($spreadsheet))->save('report.xlsx');
echo "Wrote report.xlsx\n\n";
Step 8.
Finally, check the work without opening Excel. A color scale can tell you the exact color it would paint any value. That is genuinely useful when you want the same shading on a web page as in the workbook.
Nevertheless, one detail catches everybody. You must call setScaleArray(), not prepareColorScale(). Only setScaleArray() reads the range off the worksheet first. Without those values the scale has no idea where its minimum and maximum are. Consequently it silently reports the maximum color for every value, including the smallest. It does not warn you; it just returns confident, identical answers.
// Ask the colour scale what colour each revenue actually gets.
$colorScale->setSqRef('C2:C6', $worksheet);
$colorScale->setScaleArray();
echo "Colour scale, C2:C6\n";
foreach (range(2, 6) as $row) {
    $value = (float) $worksheet->getCell("C$row")->getValue();
    printf("  %-9s %6s  #%s\n", $worksheet->getCell("A$row")->getValue(), $value, $colorScale->getColorForValue($value));
}

// Read the rules back out of the saved file.
$reloaded = IOFactory::load('report.xlsx')->getActiveSheet();
echo "\nRules in report.xlsx\n";
foreach (['B2:B6', 'C2:C6', 'D2:D6'] as $range) {
    foreach ($reloaded->getStyle($range)->getConditionalStyles() as $rule) {
        printf("  %-7s %s\n", $range, $rule->getConditionType());
    }
}
Complete code to add data bars in PHP.
<?php

require 'vendor/autoload.php';

use PhpOffice\PhpSpreadsheet\IOFactory;
use PhpOffice\PhpSpreadsheet\Spreadsheet;
use PhpOffice\PhpSpreadsheet\Style\Color;
use PhpOffice\PhpSpreadsheet\Style\Conditional;
use PhpOffice\PhpSpreadsheet\Style\ConditionalFormatting\ConditionalColorScale;
use PhpOffice\PhpSpreadsheet\Style\ConditionalFormatting\ConditionalDataBar;
use PhpOffice\PhpSpreadsheet\Style\ConditionalFormatting\ConditionalFormatValueObject;
use PhpOffice\PhpSpreadsheet\Style\ConditionalFormatting\ConditionalIconSet;
use PhpOffice\PhpSpreadsheet\Style\ConditionalFormatting\IconSetValues;
use PhpOffice\PhpSpreadsheet\Writer\Xlsx;

$spreadsheet = new Spreadsheet();
$worksheet = $spreadsheet->getActiveSheet();
$worksheet->setTitle('Team');
$worksheet->fromArray([
    ['Rep', 'Units', 'Revenue', 'Score'],
    ['Ivy', 120, 4800, 2],
    ['Marco', 340, 16150, 5],
    ['Dan', 240, 9600, 4],
    ['Priya', 180, 5400, 3],
    ['Lena', 90, 2700, 1],
], null, 'A1');

// 1. Data bar: a bar drawn inside each cell of B2:B6.
$dataBar = new ConditionalDataBar();
$dataBar->setColor('FF638EC6');
$dataBar->setMinimumConditionalFormatValueObject(new ConditionalFormatValueObject('min'));
$dataBar->setMaximumConditionalFormatValueObject(new ConditionalFormatValueObject('max'));

$bar = new Conditional();
$bar->setConditionType(Conditional::CONDITION_DATABAR);
$bar->setDataBar($dataBar);
$worksheet->getStyle('B2:B6')->setConditionalStyles([$bar]);

// 2. Colour scale: red -> yellow -> green across C2:C6.
$colorScale = new ConditionalColorScale();
$colorScale->setMinimumConditionalFormatValueObject(new ConditionalFormatValueObject('min'));
$colorScale->setMidpointConditionalFormatValueObject(new ConditionalFormatValueObject('percentile', 50));
$colorScale->setMaximumConditionalFormatValueObject(new ConditionalFormatValueObject('max'));
$colorScale->setMinimumColor(new Color('FFF8696B'));
$colorScale->setMidpointColor(new Color('FFFFEB84'));
$colorScale->setMaximumColor(new Color('FF63BE7B'));

$scale = new Conditional();
$scale->setConditionType(Conditional::CONDITION_COLORSCALE);
$scale->setColorScale($colorScale);
$worksheet->getStyle('C2:C6')->setConditionalStyles([$scale]);

// 3. Icon set: three traffic lights over D2:D6.
$iconSet = new ConditionalIconSet();
$iconSet->setIconSetType(IconSetValues::ThreeTrafficLights1);
$iconSet->setShowValue(true);
$iconSet->setCfvos([
    new ConditionalFormatValueObject('percent', 0),
    new ConditionalFormatValueObject('percent', 33),
    new ConditionalFormatValueObject('percent', 67),
]);

$icons = new Conditional();
$icons->setConditionType(Conditional::CONDITION_ICONSET);
$icons->setIconSet($iconSet);
$worksheet->getStyle('D2:D6')->setConditionalStyles([$icons]);

(new Xlsx($spreadsheet))->save('report.xlsx');
echo "Wrote report.xlsx\n\n";

// Ask the colour scale what colour each revenue actually gets.
$colorScale->setSqRef('C2:C6', $worksheet);
$colorScale->setScaleArray();
echo "Colour scale, C2:C6\n";
foreach (range(2, 6) as $row) {
    $value = (float) $worksheet->getCell("C$row")->getValue();
    printf("  %-9s %6s  #%s\n", $worksheet->getCell("A$row")->getValue(), $value, $colorScale->getColorForValue($value));
}

// Read the rules back out of the saved file.
$reloaded = IOFactory::load('report.xlsx')->getActiveSheet();
echo "\nRules in report.xlsx\n";
foreach (['B2:B6', 'C2:C6', 'D2:D6'] as $range) {
    foreach ($reloaded->getStyle($range)->getConditionalStyles() as $rule) {
        printf("  %-7s %s\n", $range, $rule->getConditionType());
    }
}
Test adding data bars in PHP.
Command line testing.
$ php data-bars.php
Result of adding data bars in PHP.
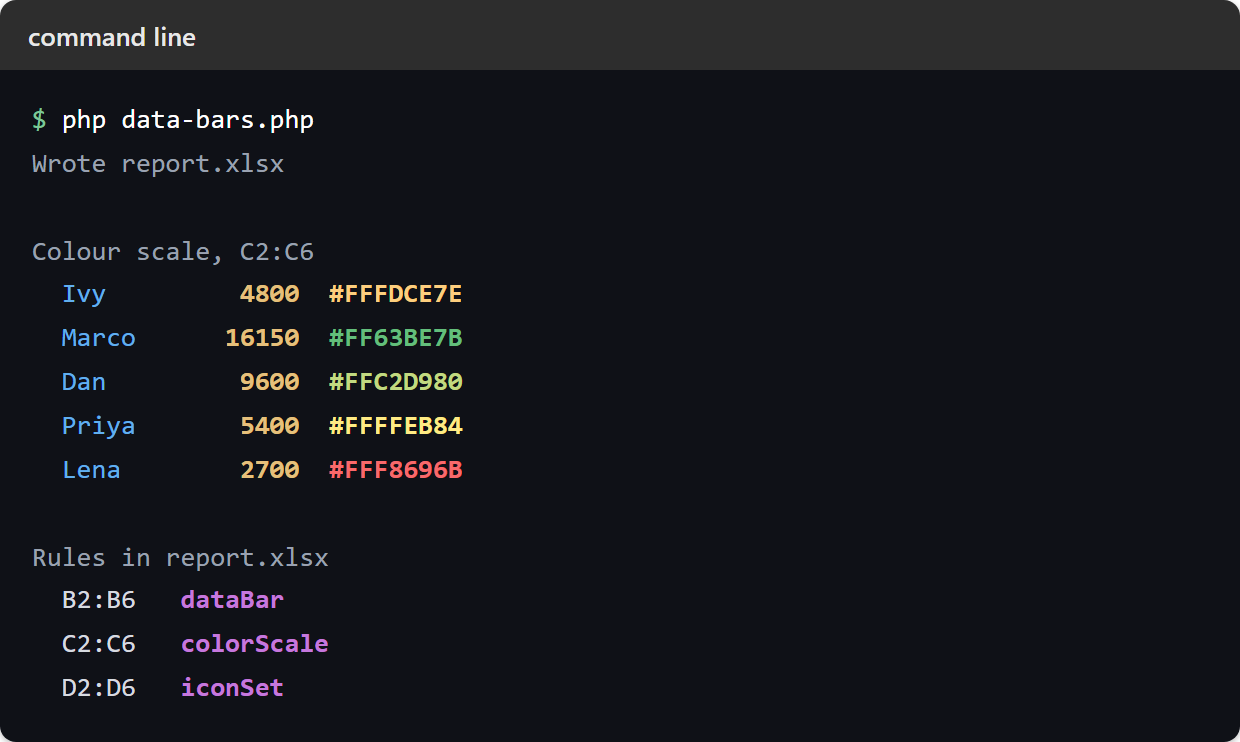
First, look at the colors. Lena’s 2,700 is the lowest revenue, so it comes back as the pure minimum red F8696B. Meanwhile Marco’s 16,150 is the maximum green 63BE7B. Priya sits exactly on the 50th percentile and lands on the untouched midpoint yellow FFEB84. Then Dan and Ivy fall between the stops, so they get blended colors that you never specified. Finally the second block confirms the round trip. All three rule types went into the file and came back with the right type:
Wrote report.xlsx

Colour scale, C2:C6
  Ivy         4800  #FFFDCE7E
  Marco      16150  #FF63BE7B
  Dan         9600  #FFC2D980
  Priya       5400  #FFFFEB84
  Lena        2700  #FFF8696B

Rules in report.xlsx
  B2:B6   dataBar
  C2:C6   colorScale
  D2:D6   iconSet
Finally, open report.xlsx in Excel. Column B shows blue bars whose length tracks the units. Column C shades from red to green, and column D shows a traffic light beside each score. None of that is a picture you pasted into the sheet. The formats are live. So editing a number redraws the bar, reshades the cell and switches the light on the spot. In short, once you add data bars in PHP the workbook keeps them as rules rather than as artwork.